
Linux System Information and Monitoring Commands

Monitoring your Linux system helps you detect performance issues, prevent bottlenecks, and troubleshoot problems quickly. Active system monitoring keeps you informed about CPU, memory, disk, and network usage. You can catch issues early and resolve them before they affect your users.
In this tutorial, we’re going to explore some essential commands and learn how to use them effectively to maintain a healthy, efficient Linux environment.
Checking Disk Usage
Efficient disk usage monitoring helps you manage space and plan for growth. You can use different commands to get a full picture of how your disk space is allocated.
Using df
The df command displays overall filesystem usage. It reports total, used, and available space on each mounted filesystem. Use df -h to see sizes in human-readable format:
df -h
This command prints the disk space for all mounted filesystems in KB, MB, or GB.
Next, run:
df -lh --total /dev/sda*
This command shows usage for all partitions on /dev/sda with a total summary. To exclude memory-based filesystems like tmpfs, use:
df -lh --total -x tmpfs
This command omits tmpfs mounts and displays only disk-based filesystems. You can also use:
df -BG
By default, the df command in Linux displays disk usage in 1K-blocks (where 1K = 1024 bytes). The -B option followed by G forces the display in gigabytes. This is for display purposes only and doesn’t change the actual filesystem block size. To check the block size of a filesystem, use the stat or tune2fs command (example sudo tune2fs -l /dev/sda1 | grep ‘Block size’ or stat -f /path/to/directory).
Instead of using the -B option every time, you can also set an environment variable: example -
export DF_BLOCK_SIZE=1G
dfUsing du
The du command analyzes disk usage by diving into directories and files. It calculates the space taken by each file and folder. For example, to list the largest files and directories under /etc, run:
sudo du -a /etc | sort -n -r | head -n 20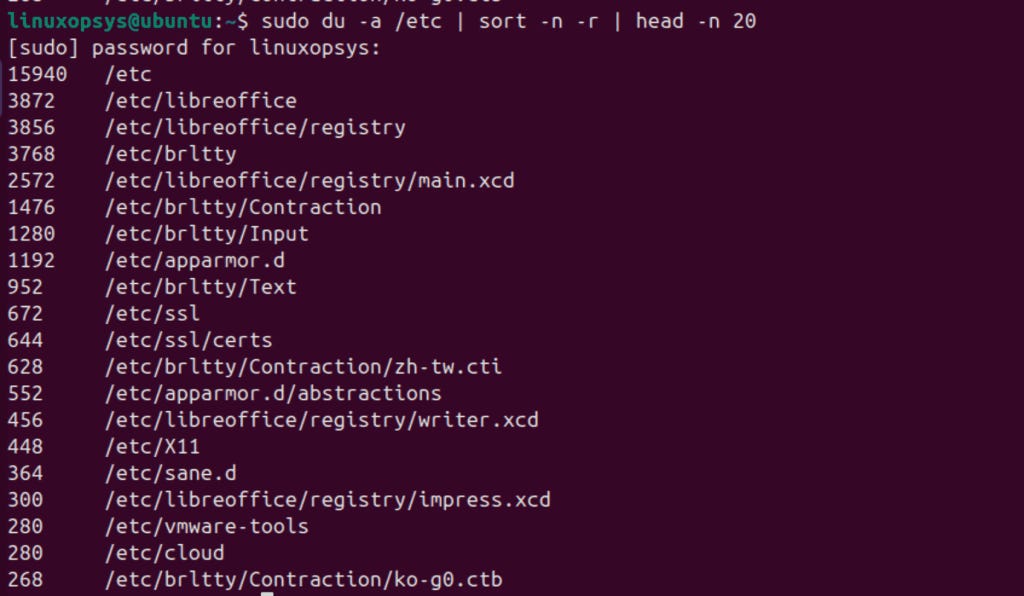
This command lists all items in /etc, sorts them numerically in reverse (largest first), and then displays the top 20 results.
Additionally, you can install and use ncdu for an interactive disk usage view. Simply run:
sudo ncdu /etc
This tool gives you a navigable interface where you can drill down into directories and easily identify space hogs.
Moreover, if you suspect open files are consuming disk space even after deletion, use lsof. Run:
lsof | grep deleted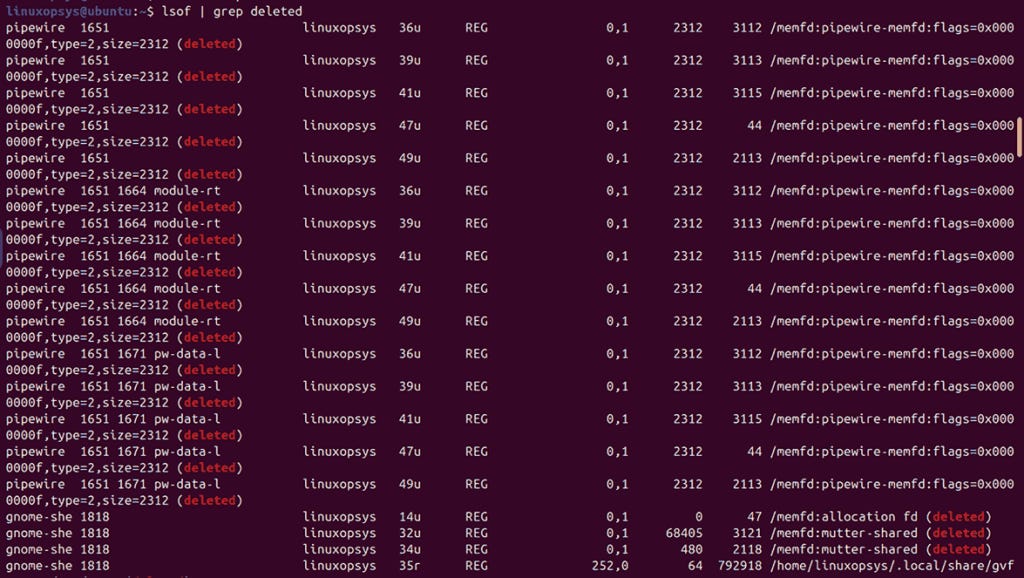
This command shows files that have been deleted but remain open by processes, helping you identify and resolve space issues.
Viewing Running Processes
Efficiently tracking running processes helps you monitor system performance and troubleshoot issues quickly. You can use several commands to view active processes.
Using ps
The ps command displays a snapshot of currently running processes. Run ps -ef or ps aux to list all processes:
ps -ef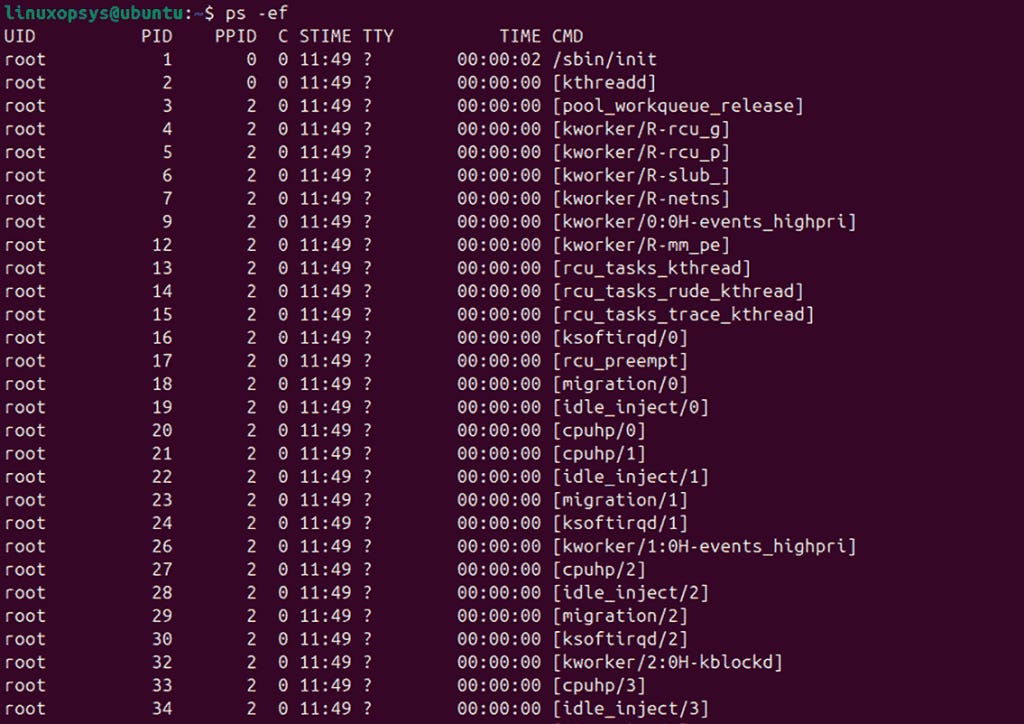
ps aux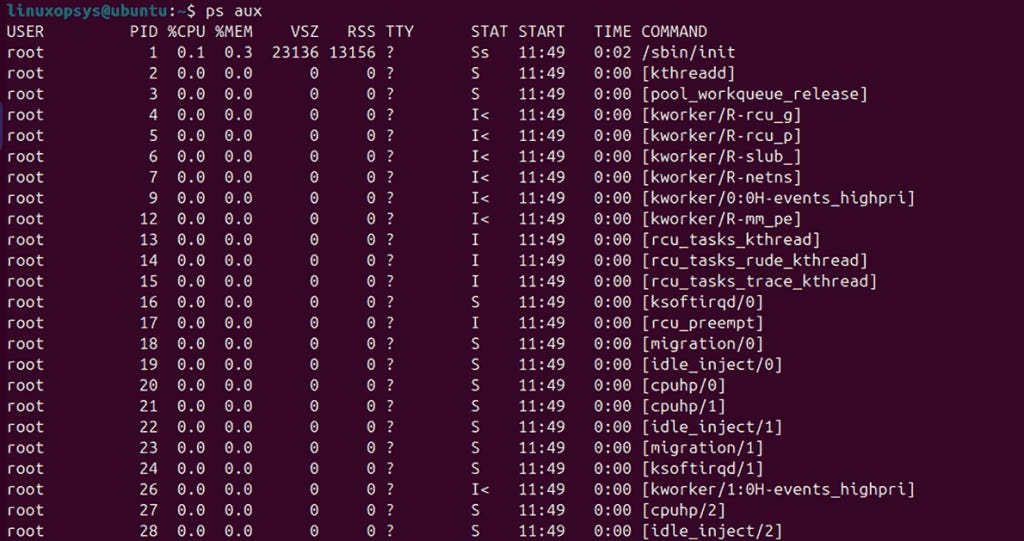
These commands show details such as process IDs, users, CPU usage, and more. Next, sort processes by memory usage using:
ps aux --sort=-%mem | head -n 10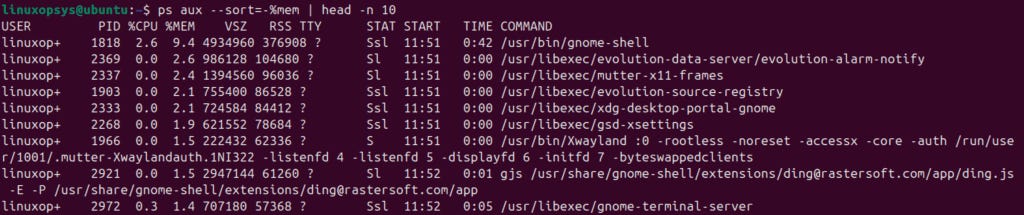
This command lists the top 10 processes consuming the most memory. Alternatively, you can sort by CPU usage:
ps -eo pid,ppid,user,%cpu,%mem,cmd --sort=-%cpu
This command displays process information sorted by CPU usage. To locate a specific process, combine ps with pgrep. For example, find Firefox processes by executing:
ps -p $(pgrep -d, -f firefox)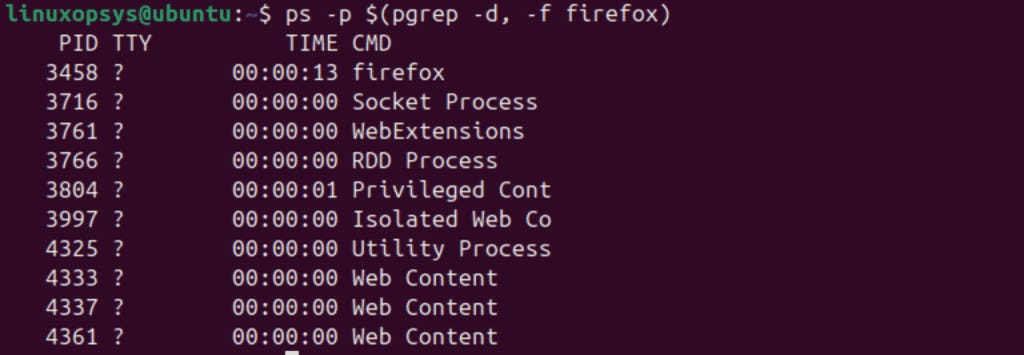
This command fetches all process IDs matching “firefox” and then displays details for each. These examples show how you can extract and sort process data to identify resource-intensive tasks. You can use the -f option with ps for a full-format listing:
Which Should You Use?
Use ps aux if you need a quick overview that includes CPU and memory usage.
Use ps -ef if you prefer a more POSIX-compliant or traditional output format.
Using top and htop
The top command provides real-time monitoring of active processes. Launch it by typing:
top
This interactive tool refreshes the process list continuously, displaying key metrics like CPU and memory usage. It helps you spot spikes and identify troublesome processes instantly.
For enhanced usability, try htop. Install it via your package manager if needed, then run:
htop
htop offers a colorful, user-friendly interface. You can scroll through the process list and use function keys to kill or renice processes. It supports interactive filtering, making it easier to locate a specific process among many.
Checking System Uptime
The uptime command reveals how long your system has run since the last reboot. Run it without any options:
uptime
This command prints the current time, system uptime, number of logged-in users, and the load average. It gives you a quick snapshot of system stability.
Next, use the -p flag for a friendlier format:
uptime -p
This command outputs makes the information easier to read and understand.
Then, combine uptime -p with awk to reformat the output. For example:
uptime -p | awk ‘{print “Uptime:”, $2, $3, $4, $5}’
This command prints a custom label “Uptime:” followed by the details from the uptime output. It splits the text into fields and rearranges them for clarity.
Finally, check remote uptime over SSH. Execute:
ssh user@remote_host “uptime”This command connects to a remote system, runs the uptime command there, and displays the result locally. It allows you to monitor remote servers quickly.
Viewing System Logs
System logs help you diagnose issues and track system events. They record messages from the kernel and various services. Use these logs to monitor system behavior and troubleshoot problems.
Using dmesg
Run dmesg to display kernel messages and boot information. This command prints messages from the kernel ring buffer. It shows hardware initialization, driver loading, and other low-level events.
For example, execute:
sudo dmesg
This command quickly displays all recent kernel messages. Use it to check for hardware errors or boot issues.
Using journalctl
Journalctl lets you view systemd logs. It collects messages from the kernel, services, and applications into one central log. Run the below command to view all logs from the system:
journalctl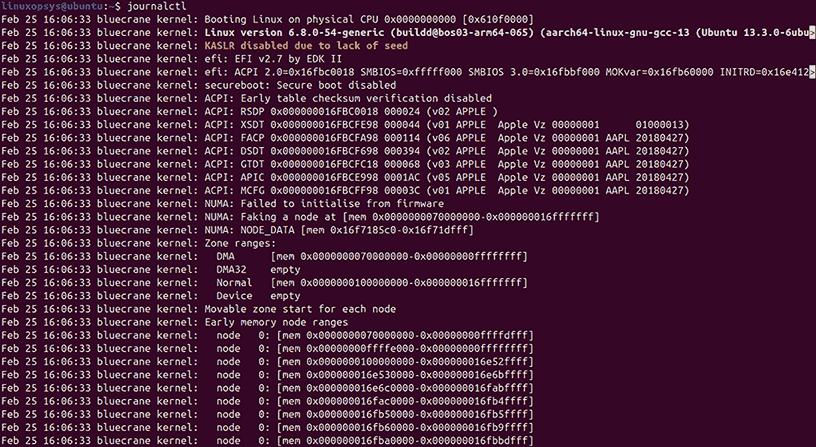
This command prints every log entry since the journal started. If you want logs from a specific service, run:
journalctl -u nginx
This command shows only log entries for the Nginx service, making it easier to isolate issues. To view logs from the current boot, run:
journalctl -bIf you prefer to see the newest entries first, run:
journalctl -rThis command displays logs in reverse order.
You can also filter logs by time. For instance, to see logs between 8:00 AM and 10:00 AM on February 20, 2025, run:
journalctl --since “2025-02-20 08:00:00” --until “2025-02-20 10:00:00”
This command narrows down the log entries to a specific period.
Checking Memory Usage
Monitor memory usage actively with the free command. Run:
free -m
This command displays memory statistics in megabytes, making it easy to read the amount of used and free memory. Next, run:
free -t -h
This command shows a human-readable summary that includes a total line for RAM and swap.
Then, inspect memory usage per process by executing:
ps -eo pid,comm,%mem --sort=-%mem | head -n 10
This command lists process IDs, command names, and their memory usage percentages. It sorts processes by memory usage in descending order and displays the top 10 consumers.
You can also combine commands to get a quick system overview. For example, run:
uptime; free -hThis prints system uptime followed by memory statistics in a human-friendly format.
Finally, monitor memory usage in real time by running:
watch -n 1 free -hThis command refreshes the memory statistics every second, allowing you to see live changes.
Thanks for reading!
If you enjoyed this content, don’t forget to leave a like ❤️ and subscribe to get more posts like this every week.
Just so good ⭐✔
Very helpful